
The complexity of local area network (LAN) monitoring ranges from packet sniffing tools to complete network management systems. The key tasks of the management network are:
- Track infrastructure utilization to ensure that devices are not overloaded.
- Monitor and ensure that all devices are operational
- The LAN monitoring platform can notify you in real time to resolve problems before they impact performance.
Since your network may contain devices from a variety of manufacturers, you don't want to bind it to a proprietary system for LAN monitoring tools. Be sure to check that the monitoring system you purchased is compatible with all the network devices you have.
LAN monitoring tool evaluation
Commercial LANs range in size from small networks to just a few computers, printers and modems to multinational systems that cover many sites.
This article recommends LAN monitoring tools that meet a variety of requirements, not just systems for large enterprises. When reviewing the available LAN monitoring tools, the following requirements were considered:
- Visualization: A monitoring tool is needed to show you the status of the entire network at a glance.
- Alert: Monitoring should include a feedback system to highlight faults and stress.
- Custom: The system should allow you to write your own scripts to automate reporting.
- Multi-vendor compatibility: The monitoring system should be able to communicate with all existing devices.
- Analysis tools: You sometimes need to be able to explore networks such as data packets.
Considering these standards, the following 10 best LAN monitoring tools, you may wish to study in depth:
1.Solarwinds Network Performance Monitor (free trial)
2.WhatsUp Gold (free trial)
3.Paessler PRTG (free trial)
4.OpManager
5.Nagios Core and Nagios XI
6.Pandora NMS
7.Zenoss
8.Dynatrace
9.ConnectWise Automate
10.Zabbix
1.Solarwinds Network Performance Monitor (free trial)
In the previous article, I have introduced the tool several times. Solarwinds is currently an important player in the LAN technology market. The company produces a range of products for network administrators that can be purchased separately or combined to form a complete network management system.
You don't have to commit to buying all the other modules to use network performance monitoring, but once you get used to the LAN monitoring tools, you might want to check out other Solarwinds utilities. The key features of this tool make it the biggest winner in the list, and it's a powerful dashboard. Get a complete picture of the performance of your entire network at a glance. Real-time metrics of network activity, including pie and line charts, can be seen instantly through a graphical presentation.

If you are responsible for multiple sites, you can extend the capabilities of Network Performance Monitor with its remote monitoring capabilities. This way, you can manage all the devices in the WAN from a central location.
One of the four panels of the overview view includes a list of critical events that occurred on the day. The real-time data provided to this overview page comes from the SNMP method. Most new network-compatible devices come with SNMP functionality pre-installed in firmware, and Network Performance Monitor automatically detects and interacts with device agents to keep track of device status.
These real-time status alerts are at the heart of the monitoring system, but you don't want to be overwhelmed by every status message provided to the monitoring platform. You can customize the interface to filter status alerts and notify different team members based on different network activity conditions that may occur. If you are responsible for a large network supported by a team of experts, this can help you manage your time more effectively. This tool is especially useful if you have a lot of hardware support outsourcing. The service provider will be notified directly, so you don't have to waste time asking for support.
The monitoring package manages wired and wireless networks. You can get down to the details of each node on the network to check for problems and track utilization.Similarly, the node details screen has a graphical display that gives you a complete picture of performance.
Network Performance Monitor is targeted at large enterprise networks, and entry-level systems are priced at $2,895. The price will increase based on the number of nodes on your network. So if you only have a small network and a very tight budget, this comprehensive LAN monitoring tool may not be for you.
2.WhatsUp Gold (free trial)
WhatsUp Gold from Ipswitch is very simple and you won't spend too much time learning how to get the most out of your surveillance system. This is an advantage for small network administrators who do not need detailed information about events that occur at remote sites. The software will set its own database through the auto-discovery module. This will map all nodes and their assigned IP addresses.

Perform continuous real-time monitoring using SNMP technology. The SNMP trap message enables the device agent to notify the central management console of the failure condition. Server and storage performance metrics are included in this monitoring system. The network traffic analysis tools in this software are compatible with NetFlow, sFlow, J-Flow, NSEL and IPFIX.
The dashboard contains red/green codes for status to make alarm and performance issues very easy to spot. You can receive an alert sent to you via SMS or email, which allows you to continue with other tasks without ignoring the network status. With the reporting tool, you can customize the report by specifying the columns of data to display and the order in which they are displayed.
Monitoring extends to cloud services. This allows your management team to track the utilization of cloud systems. This helps assess value and can also help you verify your cloud service provider.
You can use WhatsUp Gold to monitor the performance of your web application.Typical metrics generated by the system include the number of requests, response time, and bandwidth capacity. Another feature of WhatsUp Gold is its configuration management module, which goes beyond network monitoring. This allows you to back up the configuration of your network device. It will monitor version changes and software installations. This allows you to track all software on the network, including unauthorized installations.
If you use a virtual terminal, WhatsUP Gold is already providing you with services.The monitoring system can interact with Hyper-V/VMWare and map your virtual environment. You can record usage and load on a virtual machine and identify traffic that serves the virtual environment.
A small business may have only a single-site network. However, as you expand your business, you may be interested in WhatsUp Gold's remote monitoring and management facilities. These features allow you to centralize all network management tasks in one location, reducing the cost of using network operations at each site.
3.Paessler PRTG (free trial)
The Paessler PRTG system covers server monitoring as well as LAN and WAN monitoring. The underlying technology that drives this monitoring utility is the NetFlow system. This allows real-time tracking of packet transmission rates around the network. The Packet Sniffer utility provides a drill-down utility that looks down at the protocol level. However, monitoring is more than just a task of observing traffic.The Paessler PRTG LAN monitoring feature relies on SNMP to provide an alert for hardware status. Alerts provided by SNMP enable network administrators to stay ahead of the crisis. If you can stay ahead of the hardware failure and fix it before the user starts getting out of control, you can save a lot of money on the support desk.

One of the big benefits of SNMP is that it uses very little bandwidth, so monitoring with this kit does not slow down the network. The Paessler system's dashboard includes graphics, charts, and instant information about the overall state of the network. You can query individual nodes on the network for real-time status reports containing real-time data. These device-specific pages contain easy-to-understand graphics, and the entire dashboard can be accessed from any computer on the network as well as tablets and smartphones.
PRTG is especially useful for multi-site operations including Internet connectivity and cloud services. With Paessler's remote probing technology, all network management functions can be centralized in one location, remotely accessing the LAN of each site.
Many of Paessler PRTG's installation processes are automated, and integrated network discovery capabilities automatically map topologies. The LAN monitoring tool includes a template that collects status information for each device. This brings a standardized format to the monitoring effort, allowing you to pay equal attention to all devices on the network. Many aspects of the PRTG monitoring system can be customized to provide you with notifications and status that are critical to your network's success.
Paessler's PRTG free trial allows an unlimited number of sensors, but only for 30 days. There is also a free software version designed to help small businesses grow and currently allow up to 100 sensors to be used indefinitely.
4.OpManager
OpManager is produced by ManageEngine, another important player in the networking software industry. You can get a free version of the OpManager system to familiarize yourself with the features and properly monitor your small business network.

You can monitor up to 10 devices with the free OpManager. However, you still get the same level of system notifications that paid users get. The engine of the monitoring method uses SNMP. It is built into all new network-compatible hardware, so you can automatically get real-time feedback on network activity from all devices connected to the network. Another common technique for supporting the OpManager system is the NetFlow traffic monitoring method.
Whether you are using a free system or paying for it, the software can be loaded onto Linux or Windows. It includes the ability to interact with SQL-based databases as well as MySQL, Active Directory and Eventlog.
If you are considering purchasing an OpManager system, you can choose between two plans: Essential and Enterprise. Use the Essentials program to manage up to 1000 nodes and use enterprise packages to manage up to 10,000 nodes. Both options extend their monitoring to WAN and voice systems through remote monitoring and QoS capabilities.
The feature that is not available in the free version of OpManager is the auto-discovery utility. This will map your network and display it in a nice graphic in the dashboard. The topology displayed on the screen is based on real-world conditions, so you can visualize the entire network, even if it is global. The top of the dashboard home page contains miniature graphics, charts and dials. Although each will be displayed full screen if you click on them, the color coding displayed by these icons makes it easy to quickly navigate through the state of the network.
The dashboard includes device-down research and access to tablets and smartphone apps that access network status information wherever you are. The existence of the free OpManager is good news for small businesses. However, jumping to the paid version will be a small leap. It would be a good thing if the company's entry-level software package could cover 400 or 500 nodes to help small businesses enter the midsize business.
5.Nagios Core and Nagios XI
Nagios' open source network management monitoring software is completely free to use. The interface to this free system is called Nagios Core and is not very comprehensive. You'll get the basic web interface for the main download, and then you can search the Nagios Core community page to find plugins and interfaces that other users have developed for themselves and are willing to share.

If you don't have a budget for LAN monitoring tools, the Nagios Core system is a good choice. The free version of Nagios XI is free but limited and can only be used to monitor seven nodes. However, this offer and two levels of paid usage mean that Nagios XI is suitable for all sizes of networks.
The standard paid version is priced at $1995, with at least 100 nodes on the network and an enterprise version starting at $3,495. This is a one-time purchase price, including access to email support and community forums. Additional phone support is available.
With Nagios XI, real-time monitoring of Nagios Core is available, but the collected data is managed, rendered and filtered in a more understandable format. The graphics in the dashboard do all the work for you. You can immediately see where the problem is on the network. The interface page includes charts and graphs to help you get performance data at a glance.
The Nagios XI system is easy to set up because it includes auto-discovery so it can map the network itself. This feature is very useful when adding devices to the network. The configuration wizard helps you adjust the interface to your liking. User groups and personal accounts can be created to delegate partial access to data by team members.
Nagios is able to monitor devices at remote sites and can remotely monitor the physical state of the server by installing remote program execution agents on those servers.
The range of subscription options, including Nagios Core and the free version of Nagios XI for small networks, means the system is truly scalable. Simply install the software and Nagios Core can be upgraded to Nagios XI. When you switch from the free Nagios XI to the standard version and then switch to the Enterprise package, you don't lose any customizations. This is a very good feature for a rapidly expanding company.
6.Pandora NMS
The Pandora NMS installation begins with a network scan, enabling the system to map the topology. The network topology is just one of the graphics included in the dashboard to help you track the system at a glance.

The monitoring capabilities of Pandora NMS are based on SNMP. Your central network manager node will continuously poll the system to track device status.Standard SNMP alerts report critical conditions that occur without waiting for a network administrator's status request. The Pandora Engine is able to communicate with devices using SNMPv1, v2c and v3.
The Pandora software package not only covers real-time network monitoring. The broader system, called Pandora FMS, includes address management and built-in IPAM. The IP Address Manager can be run using both IPv4 and IPv6 addresses.
The third element of Pandora FMS is its configuration management system, which tracks the state of your company's software patches and detects rogue software on the system.
Whether this combination will interest you depends on whether you already have a satisfactory DDI suite and configuration management system. However, if you are looking for a brand new web toolkit, this option will work fine for you.
If you have a multi-site network, you can centralize all management of your corporate WAN into one location through remote monitoring. However, you can divide responsibilities and system access rights in the dashboard to limit the site-only access to its subnet-dashboard content that is fully customizable. You can also define roles in the console to partially access dashboard controls so that junior staff can safely participate and upload administrators to access reporting.
Pandora NMS is a Spanish product whose price is in Euros. The basic network monitoring package provides a "community" version of its open source software for free. The full-featured network management system starts at €2625 and the price increases as the number of network nodes increases. The price includes a one-year maintenance and support package. Enterprise solutions for large networks include cloud service tracking. The first year of the program starts at €3,750, including one year of support and maintenance.
Some additional features are available as additional features, but are included in the corporate plan. They include remote access systems and SAP monitoring. If you need to, consider upgrading to a corporate plan that includes additional features in the price.
7. Zenoss
Zenoss Core is an open source network monitoring system that can be installed for free. This real-time network monitoring and analysis software is available in two paid versions. You can get a live version called Zenoss Service Dynamics, or you can have a hosted cloud-based service called Zenoss-as-a-service.

Regardless of which method you choose, you will get an automatic discovery module. This automatically maps your network topology and logs all devices connected to the system. Up to 1000 network devices can be used, but the number of devices that can be owned is unlimited when using these two paid services.
Monitoring is not limited to standard network equipment, terminals and printers. It will also monitor power, server racks, ports, fans, and more.
The network monitoring system is based on SNMP. It is automatically compatible with all new devices currently connected to the network. SNMP alerts provide device failure notifications that are directly fed back to the dashboard. NetFlow monitors traffic around the network.
Whether you choose to use a field system or a cloud-based Zenoss LAN monitoring service version, the dashboards are web-based, meaning that they can be accessed from any GUI operating system. Zenoss can be extended to cover multiple sites and remotely monitor by installing collectors on each site.
ZenPacks can extend standard monitoring software. These are notification attachments that meet the specific hardware requirements of a range of well-known equipment manufacturers. There is no need to install all available ZenPacks.However, knowing the existence of a specific device's ZenPack will make it easier for you to purchase new devices for a multi-vendor environment.
All types of Zenoss network monitoring software include server and storage monitoring functions, all of which include IP address management.
8. Dynatrace
Dynatrace is different from all other network monitoring systems in this list. It focuses on the performance of the network connection, not the state of the device connected to the network. The graphical representation of the network is amazing, they can highlight the complex locations of physical wiring and let you know how to better network.
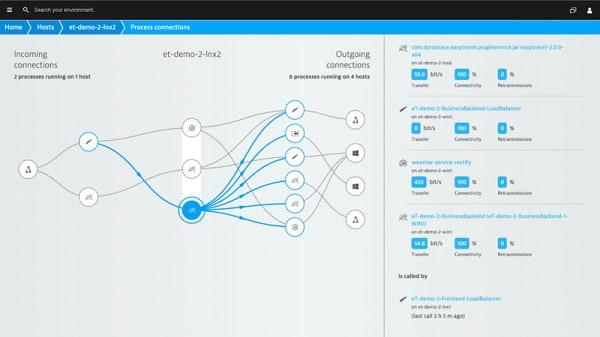
Real-time network monitoring extends to virtual environments. Like the physical network, Dynatrace will discover your connections and map them. The layout of the virtual environment shows the traffic that each virtual machine attracts, making it more likely that you can adjust capacity. Nodes mapped as part of a virtual environment can also include any cloud services used by your business.
Dynatrace analyzes network traffic at the process level. You will be able to see which processes are using the most resources and which aspects of your infrastructure are tight. In addition to network resources, Dynatrace also provides server utilization metrics including memory, disk and CPU usage.
The Dynatrace system is ideal for online business. You can track application performance and understand how each user's activity affects software activation, handling network activity and resource usage. The representation of network activity relies heavily on mapping. This is a very unique method of performance monitoring and is very effective. The focus on process rather than device performance makes it more like a network analyzer than a simple monitoring tool.
If you look at the other network monitoring tools in this list and make sure they don't really provide you with detailed information about the data stream you are looking for, then Dynatrace might be the answer to your question.
9. ConnectWise Automate
ConnectWise provides a range of network services, and its network monitoring system is called Automate. This cloud-based solution is targeted at small and medium-sized businesses. The company will not announce its price on its website.Instead, you must contact a sales representative to negotiate a quote. For companies, the secret pricing method may be a bit unpleasant.

The dashboard provides multiple view formats for your data, so you only need to look at a simple list of events or get a graphical display of real-time data.
The Automate name explains how the package operates. The idea is that the monitoring system will do all the work for you, including network discovery and user tracking. With a few extra features, many network management tasks can be run automatically. For example, version control is usually not what the network monitoring system expects. However, Automate includes a patch management tool that records all software versions on the system and allows you to update all versions of the software from a central location.
ConnectWise Automate is not limited to just one site. The software provides services for multiple clients of the MSP and its numerous networks. Automation can monitor multiple locations based on IP ranges and consolidate subnets of these client networks.
Remote management tools such as ConnectWise Control are included with BuyWise Automate. This may be a good solution for software or IT service providers because it provides complete IT support for your IT department, not just network monitoring software.
10. Zabbix
Zabbix is another open source system. One of the benefits of open source software is that anyone can generate add-ons. The core program is provided free of charge, and most add-ons are also available for free.

Although it's free, the dashboard has a very professional look. You can switch the elements of the dashboard to display the most important information in the most prominent areas of the screen. Dashboard features include real-time event data, graphics, and color-coded lists to instantly identify important information.
Zabbix's real-time network monitoring module relies on SNMP, so you can benefit from the device agents already installed on your device. The Zabbix system can monitor cloud services, application performance, hardware such as racks and UPS, and servers. If you have other sites that you want to centrally manage, the system can also implement remote monitoring.
Zabbix doesn't have a pre-written reporting module, but can create its own custom reports and find report formats written by others on the Zabbix website's community forum.
One weakness of many network protocols is that they run at a lower level in the protocol stack, which makes encryption difficult. Zabbix includes an encryption layer for locking eavesdrops and sniffers and enabling monitoring data to pass through the network securely. The encryption system makes the authentication process available, so you can create different permission levels to access the data available in the Network Monitoring dashboard.
Zabbix is for small and medium-sized businesses, so if you just started, this free network monitoring solution will be your ideal choice.
Open source network software
The concept of open source software is becoming more and more common in network technology. This is because proprietary closed source systems can mask malware, so network owners tend to be large software providers such as Microsoft and Cisco. However, large companies are sometimes proven to be not entirely trustworthy.
Therefore, the open source movement is seen as a positive solution for software security. You might think that allowing each hacker in the world to access the source code of the network software will give them time to study how to crack it and hack into the network. However, open source software for security-sensitive applications typically includes tried and tested authentication procedures that no one can crack.In essence, the open source model relies on a thorough security approach, rather than expecting confidentiality to suffice.
Open source network monitoring provides free entry-level network management software access for small businesses.
Select network monitoring tool
If you run a small business and need to start buying surveillance software for an extended network, check out some of the open source options listed in this article. If you want a high-quality system that can continue to monitor network activity as your business expands, then Solarwinds, OpManager and Paessler PRTG may be your best choice. Take a look at the other monitoring systems in our list, such as Dynatrace, to discover some unique features that may be better than network monitoring needs.
No comments:
Post a Comment