
Malware Analysis
Just wakeup from a Sunday morning and you have been alerted for a security breach. You’re heading to the office to find out what has happened. You will start looking at the incident with Dashboards around you. The IPS/IDS and WAF alerts show you that there has been malware/unwanted application in your system. The Firewall connection list shows you that one of your network hosts has unusual network connections to outside of your network. And finally your Antivirus Dashboard shows you the information about this infected host. The only thing left to do is find out what kind of malware we have in our host and how capable of its malicious code. Of course, you will instruct to your network team and Antivirus team to perform an immediate damage assessment of your network while scan the infected host in an isolated environment. Not too bad for a Sunday morning!!! you will get back to your home thinking that the incident is under control.

In summary, what we can do to protect our network assets, network resources and most importantly your data. As preventive measures, you can update the IDS hashes to detect the next attack from similar malicious software and update the Antivirus signature database to detect at the host level. Apart from all these measures, you still need to find out more information about this malicious software or in other words, you need to conduct a malware analysis to find out the exact behavior of this nasty little piece of software.
What is a malware
As the first step, what is a malware? Can we consider any piece of code that is not authorized to be in our network as a malware? In briefly, we can define any software that does perform any action to causes harm to a user, computer, or network as a malware. This includes but is not limited to viruses, Trojan horses, worms, rootkits, scareware, and spyware.
If Malware is determined to be harmful, The Malware analysis is the method of investigates a pies malware to understand how it works and how to controlled/eliminate its functionality.
The purpose of malware analysis is usually to provide the information you need to respond to a network intrusion. Your goal is to determine exactly what happened, and to ensure that you’ve located all infected machines and files. When analyzing suspected pieces of software, first of all you need to explore what the suspicious binary can do, how to detect it on your network, and how to measure and contain its damage.
Setting up the Lab environment
First of all, if you are not equipped with a proper lab environment to conduct a malware analysis, you might need to reconsider the options you have. As an example, are you using a virtual environment to conduct the analysis or you have separated physical systems. In contrast to virtual environments, the data can leak to your base system and this eventually harm entire system. Most modern malwares are capable of detecting virtual systems and change its behaviors to stay undetected. In our opinion, VMware provides the best solution for the malware analysis in virtual environments.
On the other hand, having dedicated physical systems can have several disadvantages such as restore the system in every analysis cycle. We use open source, freely available udpcast tool for this purposes. In the case of you have sufficient budget, Norton Ghost provides more advance features to restore your system.
Having decided the environment, the next step would be defining the network access to those systems. The advanced malwares are capable of detecting changes of the IP address and hide themselves or not reveal the information about its real destination node. These detections can trigger some other hidden functions such as DOS attack to your internal hosts. Therefore, we recommend isolated network environments with virtual servers which include but not limited to DNS, HTTP and Mail servers. In the case of additional test with internet connections, this isolated network can implemented via Firewall with strict rule set to monitor the possible open and drop connections.
The Tool set
After completing the lab environment, next step is to select a tool set that ease your analysis process. We recommend the following tools which can come in handy at various stages in the analysis cycle. In here, we are more focused on the freely available tools (including DEMO versions) over commercial tools. The following section provides a brief description as in their manufacture product note. We will use these tools in various stages of our analysis.
OllyDbg
OllyDbg is an application-level debugger. OllyDbg interface shows the disassembly, hex dump, stack, and CPU registers. Additionally, OllyDbg supports run tracing, conditional breakpoints, PE header viewing, hex editing, and plug-in support.
At first Startup, OllyDbg asks to setup User Data Directory (UDD) and Plugins directory.UDDis used to keep debugged application specific information like breakpoints and other information and obviously you need to save plugins in Plugins directory. It provides wide Debugging Options like break on new module or when thread is created, how to process exceptions etc. OllyDbg supports setting of Hardware Breakpoints, Software Breakpoints, Memory Breakpoints and even Conditional Breakpoints.
UPX
UPX achieves an excellent compression ratio and offers very fast decompression. Because of in-place decompression, the executable suffers no memory overhead or other drawbacks when decompressing most of formats.
Autoruns
This utility, which has the most comprehensive knowledge of auto-starting locations of any startup monitor, shows you what programs are configured to run during system boot up or login, and shows you the entries in the order Windows process them. These programs include ones in your startup folder, Run, RunOnce, and other Registry keys. You can configure Autoruns to show other locations, including Explorer shell extensions, toolbars, browser helper objects, Winlogon notifications, auto-start services, and much more. Autorunsgoes way beyond the MSConfig utility bundled with Windows Me and XP.
ProcessExplore
The Process Explorer display consists of two sub-windows. The top window always shows a list of the currently active processes, including the names of their owning accounts, whereas the information displayed in the bottom window depends on the mode that Process Explorer is in. In the DLL Mode, you’ll see the DLLs and memory-mapped files that the process has loaded. Process Explorer also has a powerful search capability that will quickly show you which processes have particular handles opened or DLLs loaded.
The unique capabilities of Process Explorer make it useful for tracking down DLL-version problems or handle leaks, and provide insight into the way Windows and applications work.
Process Monitor
Process Monitor is an advanced monitoring tool for Windows that shows real-time file system, Registry and process/thread activity. It combines the features of Filemon and Regmon utilities, and adds an extensive list of enhancements including rich and non-destructive filtering, comprehensive event properties such session IDs and user names, reliable process information, full thread stacks with integrated symbol support for each operation, simultaneous logging to a file, and much more. Its uniquely powerful features will make Process Monitor a core utility in your system troubleshooting and malware hunting toolkit.
Active Registry Monitor
Active Registry Monitor (ARM) utility can use to analysis the changes of the Windows registry entries, capture of the status of the registries and compare it with the previous status.
TCPview
TCPView is a Windows program that will show you detailed listings of all TCP and UDP endpoints on your system, including the local and remote addresses and state of TCP connections. On Windows Server 2008, Vista, and XP, TCPView also reports the name of the process that owns the endpoint. TCPView provides a more informative and conveniently presented subset of the Netstat program that ship with Windows.
Winvi
WinVi is a free editor for MS Windows for editing and automatic detection of Unicode files in UTF-8, UTF-16 Little Endian and UTF-16 Big Endian encodings. Winvi is highly compatible with notepad and basically it work as a Vi editor for Windows. In malware analysis we use this tool as a hexadecimal editor which can support up to 2Gb files.
Malware Analysis Techniques
Most often, when performing malware analysis, the only thing you might have is the malware executable itself, which won’t give too much information as it’s meant to be not human-readable. In order to make sense of it, you’ll use a variety of tools and tricks, each revealing a small amount of information.
You’ll need to use a variety of tools in order to see the full picture. There are two fundamental approaches to malware analysis: static and dynamic. Static analysis involves examining the malware without running it. Dynamic analysis involves running the malware in controlled environments.
Basic Static Analysis
Basic static analysis consists of examining the executable file without viewing the actual instructions. Basic static analysis can confirm whether a file is malicious, provide information about its functionality, and sometimes provide information that will allow you to produce simple network signatures. Basic static analysis is straightforward and can be quick, but it’s largely ineffective against sophisticated malware, and it can miss important behaviors.
Basic Dynamic Analysis
Basic dynamic analysis techniques involve running the malware and observing its behavior on the system in order to remove the infection, produce effective signatures, or both. However, before you can run malware safely, you must set up an environment that will allow you to study the running malware without risk of damage to your system or network. Like basic static analysis techniques, basic dynamic analysis techniques can be used by most people without deep programming knowledge, but they won’t be effective with all malware and can miss important functionality.
In Practice
In here, we shows a practical example on how to analysis a pies of malware to identify its functionalities. We do not recommend conducting this exercise in a home environment and any such actions are at your own risk.
The following virus is real virus and it’s created under the Honeynet Project to increase the security awareness around malware specimens and to point out the need of additional defensive countermeasures in order to fight current malware threats.
Statically analysis
As the first step, we conduct a preliminary information gathering via looking at the details of the virus and viewing it in Hex editor. This reveals some Strings in the code of the virus. These Strings will give us a brief understanding of what we are looking forward to see even though this information might miss leading due to encryption and scramble of the actual data.

Hex view of the virus using Hexeditor
Load the RaDa virus in to the OLLYDBG to conduct a code analysis in order to find out its functional capabilities. As the first step, open the executable in the OLLYDBG to view the basic details. The following figure show the CPU, Registers and memory information of the malware with including warning message saying that the code either compressed, encrypted o scrambled to hide its true nature.
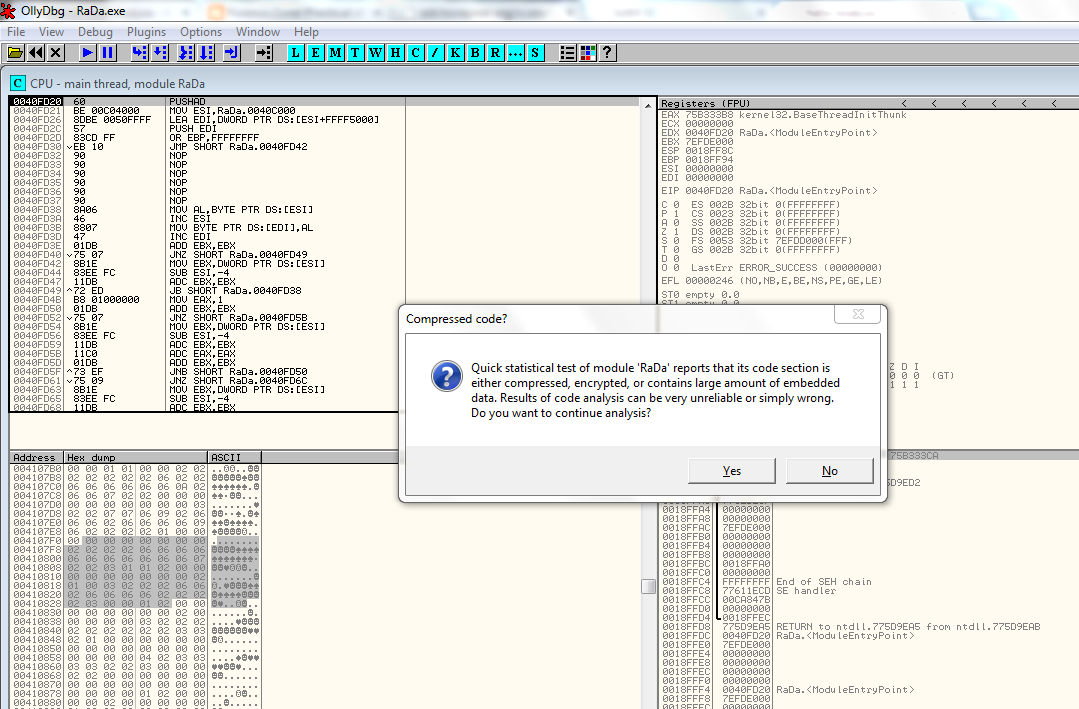
Encrypted or obfuscated code warning in OllyDbg
To find out more about the encryption o scramble nature of the virus, we use the UPX executable decompression utility.

UPX trying to unpack code first time
As in the above picture, the virus resists to unpack via common method. Therefore we force the un-packing process via “upx –9 –brute” operations though we were unable to unpack the .exe.
This led us to change the cause of the static analysis to mild version of the behavioral analysis. Meaning we need to execute the virus in a controlled environment and see its main functions, starting points and so on. To achieve such control in the execution, we might need to find out a break point of the virus. We can find out this information via a Memory Map of the virus. The Memory can be obtained using OLLYDBG o IDA Pro tools.

Memory map of the malware showing JDR0 and JDR1
The Memory map indicates that there are three sections with in the RaDa binary: JDR0, JDR1, and .rsrc. The entry point for RaDa.exe (0x0040FD20) is located in the JDR1 section. We can find out more information by double clicking on the JDR0 section from within the Memory Map window though in this case JDR0 segment is blank.
The following screen shot has been taken from the IDA PRO dissembler though this can be done via OLLYDBG as well. The capture shows the detailed view of the JDR0 memory location in the virus.

IDA PRO view of the JDR0:004018A4 in the Memory Map
The following screen capture shows that the JDR1 unpacks the packed code and place it into JDR0. The execution will jump to unpacked code in JDR0. The ESI register is point out to the address of the encrypted code location. The EDI register shows the memory location where the decrypted code can be found after it copied. At the end of the JDR1, it jumps to the newly unpacked code to continue.

IDA Pro view of the JDR1:0040FD20 in the Memory Map
Furthermore, looking at the General Register view and EIP view of the IDA Pro we can consolidate the Memory position JDR1:0040FD20 as the starting point of the program. Being said that, we still need to get a useful String dump from its packed code.

Executable modules of the malware RaDa
As result of the static analysis, now we know what we are dealing with and its processors. This provides us a good stage to conduct a Behavioral Analysis or dynamic analysis of the content.
Dynamic analysis
In here, we run the virus in a controlled environment to see its capabilities of opening connections to outside world (calling home), the Registry alterations, file system modifications and the running processes. To monitor such activities we used TCPView, Activity Registry Monitor, Process Explorer, Process Monitor and Autorns Applications.

File system modification by the virus

Startup process of the RaDa in GUI mode
The first step is to find out what are ports and the connections of the virus that might open to outside world. The TCPView shows outgoing connection details of the malware.

TCPView of the open connections
The Process monitor and ARM shows the newly altered Registry keys of the local system.

Process Monitor view of the virus with its registry entries
As an observation, we could see that the virus operating behind the Internet Explorer application to hide its self from the naked eye. The only indication we could see is that the process “IEXPLORER.EXE” is open by the virus to connect its remote pier of 10.10.10.10 in port 80. Also the process seems to consume more and more memory.

Identifying the hidden functionalities of the virus

Rada.exe modification of the directory

RaDa.exe Registry alteration for persist between reboots.

RaDa.exe – Running DLLs as found in the Static Analysis Executable modules
Conclusions:
Active Registry Monitor shows that the following registry key was created, HKLM\SOFTWARE\Microsoft\Windows\CurrentVersion\Run\RaDa:C:\RaDa\bin\RaDa.exe. It allows RaDa to persist between system reboots.
The TCPView shows there were connection attempts from IEXPLORE.EXE, Internet Explorer, to 10.10.10.10:80. It seems RaDa is using internet Explore as tool to connect to the external system.
Via Process Monitor we found out that the “C:\RaDa, C:\RaDa\tmp” and “C:\RaDa\bin” directories were created. The RaDa.exe is copied to the C:\RaDa\bin\ directory.
This Analysis gives you a brief introduction to Malware Analysis. In the future we will post our experience on similar analysis to give you a better picture about what actually out there and how we can understand them in order to minimize their impact. And also we would like to point out that this article mealy covered a tip of an iceberg of malware analysis.
Visit our Spanish website at Hard2bit Data Forensics.
No comments:
Post a Comment